
Virus Watch preliminary findings on 21 Feb 2022
You can find our most recent results at findings so far.
Virus Watch is a research study run by University College London and the NHS. The study aims to identify how COVID-19 spreads, and how to stop it. Findings so far presented on this page are early, preliminary results and should be interpreted with caution as they have not yet been peer-reviewed by scientists external to our research collaborators. We are presenting these early findings for participants, the general public and policy makers. A detailed description of the Virus Watch study and our research questions can be found in our study protocol. Virus Watch began recruiting people in June 2020 and as of 21st February 2022, 24,287 households and 58,678 people across England and Wales have joined the study.
Table of contents
- Summary of findings
- Effectiveness of SARs-CoV-2 booster vaccines
- Waning of antibodies after booster vaccines
- Longer term antibody responses after SARs-CoV-2 infection
- Inequalities in access to paid sick leave among workers in England and Wales
1. Summary of findings:
Effectiveness of SARs-CoV-2 booster vaccines
- We calculated the effectiveness of booster vaccines against SARs-CoV-2, comparing differences by the primary vaccine course that participants had.
- We found no difference in protection after Pfizer vaccine boosters when comparing those with a primary course of Pfizer to those that had AstraZeneca.
- Our findings demonstrate the importance of booster (third) doses to maintain protection and suggest that these should be prioritised to those who received AstraZeneca as their primary course.
Waning of antibodies after booster vaccines
- We analysed blood samples from vaccinated adults participating in Virus Watch to provide an early indication of how a third booster (Pfizer) impacts antibody levels over time.
- We found that there were no differences in post-booster antibody levels by second dose vaccine type, age, sex or clinical vulnerability.
- Post-booster peak antibody levels exceeded those post-second dose. However, post-booster antibody levels also appeared to wane faster compared to post-second dose.
- Faster waning trajectories post third-dose may have implications for the timing of future booster campaigns or four-dose vaccination regimens for the clinically vulnerable.
Longer term antibody responses after SARs-CoV-2 infection
- We examined antibody responses after SARs-CoV-2 infection to improve our understanding of how antibody levels changed over longer periods of time
- Approximately 4 out of 5 individuals had a positive antibody result to nucleocapsid protein – the antibody that is only present after infection with SARs-CoV-2.
- Antibody levels to nucleocapsid protein peaked between 90 – 119 days, and then began to decline. The length of time that nucleocapsid antibodies were detectable varied by age and sex.
- As only 4 in 5 participants with prior PCR confirmed infection had detectable nucleocapsid antibodies at any time point up to 269 days after infection, seroprevalence studies on anti-N alone may underestimate the true cumulative incidence of infection.
Inequalities in access to paid sick leave among workers in England and Wales
- We examined factors associated with access to sick pay among UK workers.
- We found stark inequalities in access to paid sick leave among workers in England and Wales.
- Older workers, workers from certain minority ethnic backgrounds, workers in low-income households and those in working class occupations are more likely to lack access to paid sick leave.
- Unwarranted age and race inequalities in access to sick pay our research reveals is suggestive of labour market discrimination. Occupational differences in access to sick pay are also cause for concern. Policymakers should consider expanding access to sick pay to mitigate transmission of Covid-19 and other infectious disease epidemics in the community as we ‘learn to live with Covid’.
You can find our previous findings on the link below.
- Preliminary findings November 2020
- Preliminary findings January 2021
- Preliminary findings March 2021
- Preliminary findings May 2021
- Preliminary findings June 2021
- Preliminary findings December 2021
Detailed Findings
2. Effectiveness of SARs-CoV-2 booster vaccines
The Omicron (B.1.1.529) variant has increased SARs-CoV-2 infections in double vaccinated individuals globally, particularly in AstraZeneca recipients who we previously estimated had a 35% increased risk in SARs-CoV-2 infections when compared to Pfizer recipients after two doses. To tackle rising infections, the UK accelerated booster vaccination programmes used mRNA vaccines (e.g. Pfizer) irrespective of an individual’s primary course vaccine type with booster doses rolled out according to clinical priority. It is unknown whether this comparative difference between the vaccine types exists after receiving a booster dose.
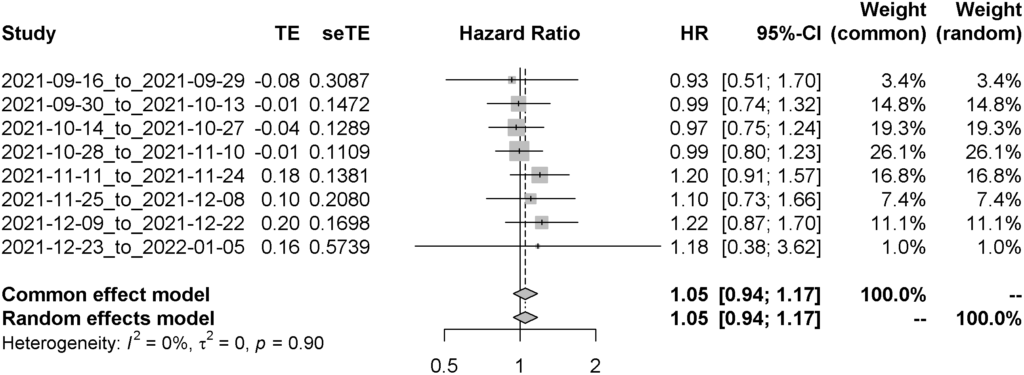
We analysed a total of 19,692 participants who received their booster vaccination between September 16th 2021 to January 5th 2022. Both median age and clinical vulnerability status decline through time for both vaccine types. The rates of infection had also changed through time, particularly since Omicron became the dominant variant of concern in the United Kingdom. After adjusting for age, sex, clinical vulnerability status, and index of multiple deprivation, we found no difference between the risk of infection of SARs-CoV-2 between those who received different COVID-19 vaccines as their primary course in addition to an mRNA-based booster vaccine (Adjusted Hazard Ratio – 1.05 [95%CI: 0.94 – 1.17]).
Figure 1. Distribution of age and clinical vulnerability status by date of booster vaccination. As time went along, both decreased, representing the prioritised distribution of the booster vaccine.

Figure 2. Cumulative incidence rates of SARs-CoV-2 through time, stratified by time of receiving a SARs-CoV-2 vaccine.

Figure 3. Forest plot of the comparative effectiveness of Oxford/Astrazeneca versus Pfizer/BioNTech; values below 1 mean Oxford/Astrazeneca is better at preventing SARs-CoV-2 infections whilst values above 1 represent Pfizer/Astrazeneca is better at preventing SARs-CoV-2 infections.
Please see this link for our full analysis.
3. Waning of antibodies after booster vaccines
Breakthrough SARS-CoV-2 infections in individuals who have received two doses of a COVID-19 vaccine are now routinely reported. These breakthrough infections are partially attributed to anti-spike antibody (anti-S) waning after receiving the second vaccine dose and the emergence of new variants. The two most commonly-used vaccines in the UK, Pfizer and AstraZeneca, employ different mechanisms of generating immunity against SARS-CoV-2. We have previously shown that compared to Pfizer, two-dose immunisation with AstraZeneca induces substantially lower peak anti-S levels and is associated with a higher risk of breakthrough infections.
The UK government initiated a booster vaccination campaign in September 2021, initially targeting people deemed to be more vulnerable to severe COVID-19 outcomes. This was subsequently expanded to the entire adult population following the emergence of the immune-evasive Omicron variant. To provide an indication of how a third Pfizer booster dose impacts anti-S antibody levels, we performed a cross-sectional analysis using capillary blood samples from vaccinated adults participating in Virus Watch.
4,682 adults submitted one or more valid capillary blood samples after their booster dose, between August 18, 2021 and January 6, 2022 (7,406 total samples). 8,680 adults submitted one or more valid samples after their second dose, between July 1, 2021 and January 6, 2022 (24,271 total samples). These samples were tested for antibodies to the S1 subunit of the wild-type SARS-CoV-2 spike protein (range 0.4–25 000 units per mL [U/mL]) using the Elecsys Anti-SARS-CoV-2 S immunoassay. We analysed anti-S levels by week since the third dose for vaccines administered on or after September 1, 2021 and stratified the results by second dose vaccine type (AstraZeneca or Pfizer), age, sex and clinical vulnerability (defined in Tables S2 and S3). Individuals who had previously submitted blood samples that were seropositive for anti-Nucleocapsid antibodies were excluded. We also compared anti-S levels post-second dose to those post-booster.
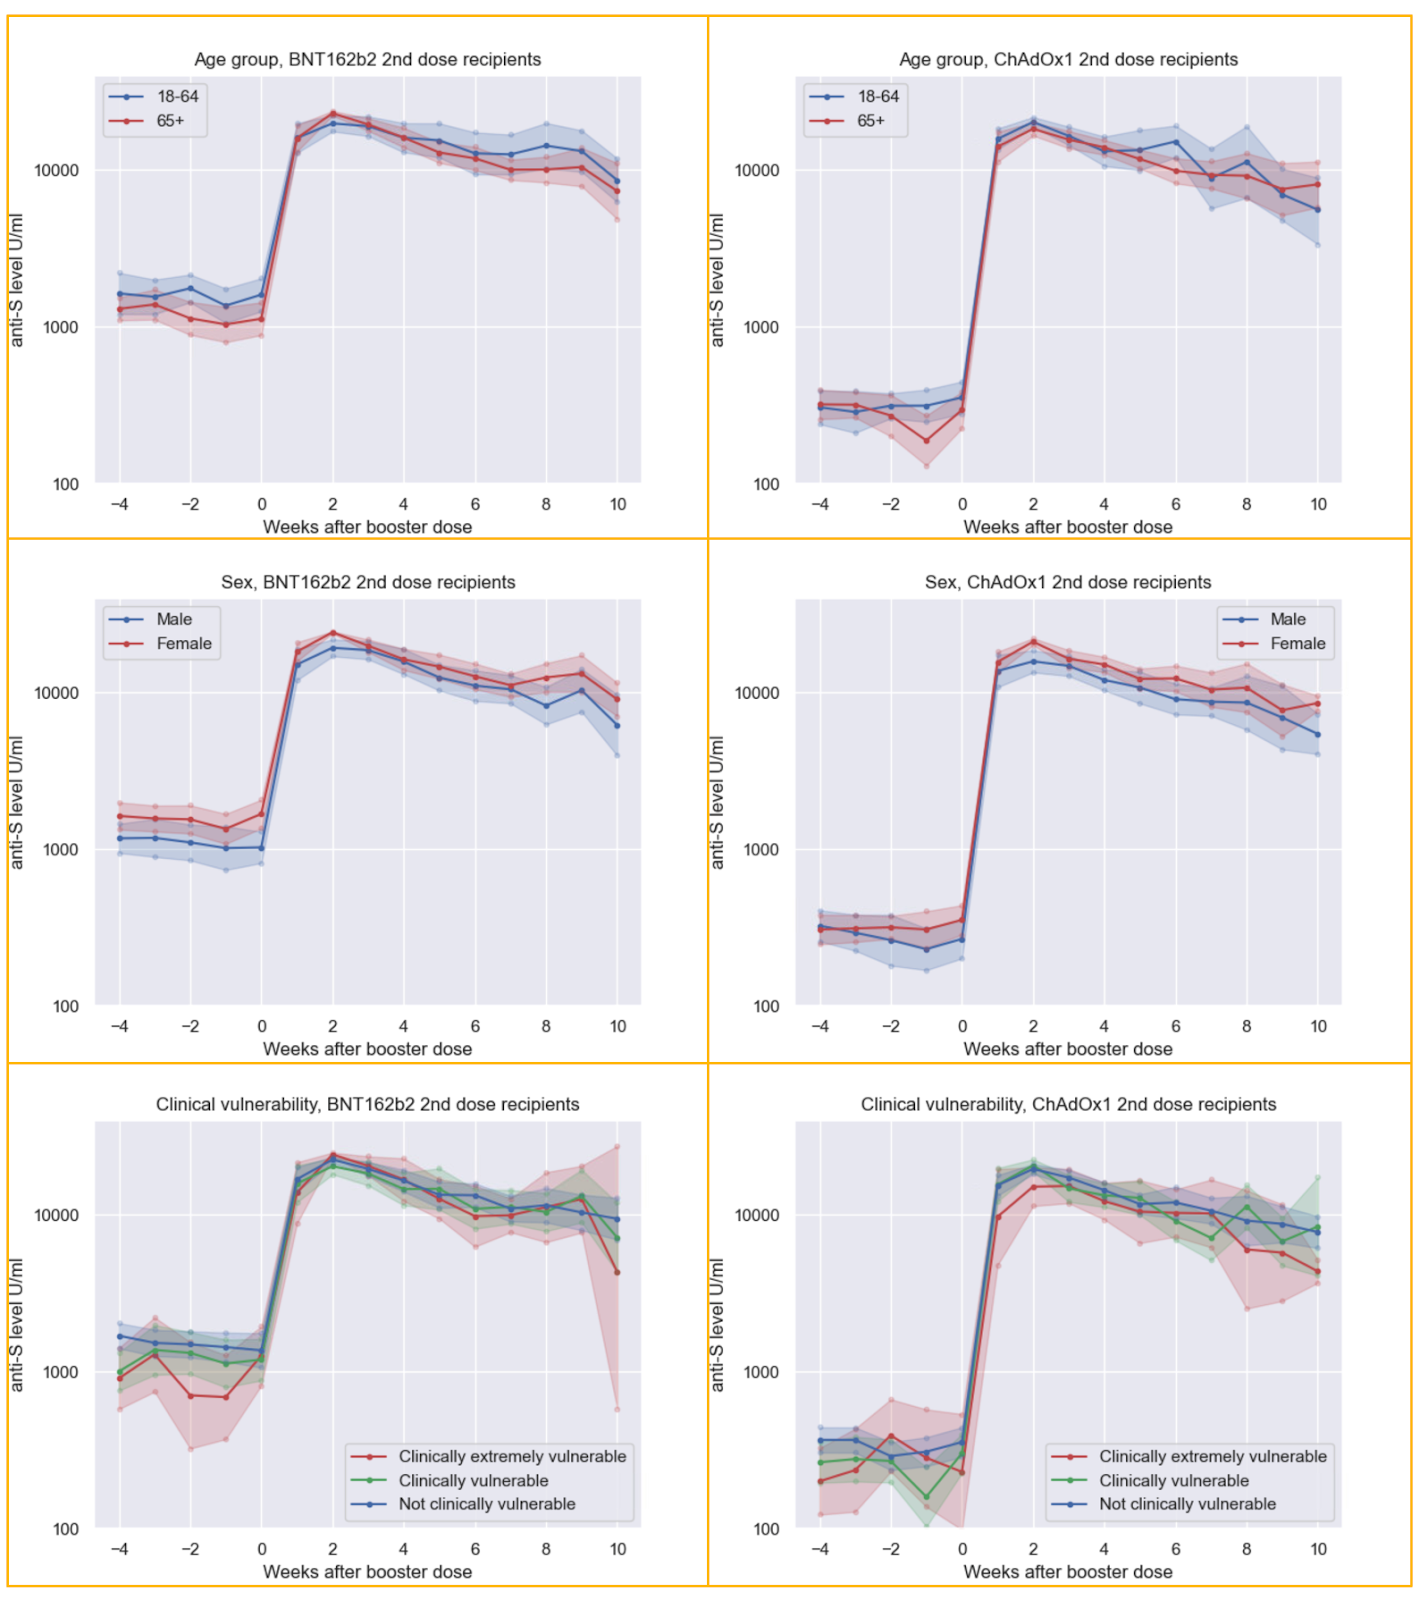
Anti-S levels peaked at two weeks post-booster for BNT162b2 (22,185 U/mL; 95%CI: 21,406-22,990) and ChAdOx1 second dose recipients (19,203 U/mL; 95%CI: 18,094-20,377). These were higher than the corresponding peak anti-S levels post-second dose for BNT162b2 (12,386 U/mL; 95%CI: 9,801-15,653, week 2) and ChAdOx1 (1,192 U/mL; 95%CI: 818-1735, week 3) (Figure 4). No differences emerged by second dose vaccine type, age, sex or clinical vulnerability (Figure 5). Anti-S levels declined post-booster for BNT162b2 (half-life=44 days) and ChAdOx1 second dose recipients (half-life=40 days). These rates of decline were steeper than those post-second dose for BNT162b2 (half-life=54 days) and ChAdOx1 (half-life=80 days). For BNT162b2 second dose recipients, median antibody levels at 26 weeks were predicted to be 1,487 U/m post-booster compared to 1,285 U/mL at 26 weeks after the second dose.
Our findings suggest that peak anti-S levels are higher post-booster than post-second dose, but that levels are projected to be similar after six months for BNT162b2 recipients. No differences in post-booster antibody levels emerged by second dose vaccine type. This finding contrasts with antibody responses post-second dose, which were substantially lower for ChAdOx1 than BNT162b2 recipients. The magnitude and trajectory of post-booster anti-S response was similar across age groups and by clinical vulnerability status. Higher peak anti-S levels post-booster may partially explain the increased effectiveness of booster vaccination compared to two-dose vaccination against symptomatic infection with the Omicron variant. Anti-S levels also appeared to wane faster following the booster dose; however, ten weeks after vaccination these remained above previously-estimated thresholds for breakthrough infection with the Delta variant due higher peak levels. Thresholds for breakthrough infection with the Omicron variant are currently unknown. Faster waning trajectories post third-dose may have implications for the timing of future booster campaigns or four-dose vaccination regimens for the clinically vulnerable.
Figure 4. Anti-S levels (U/mL) over time since BNT162b2 booster dose (D2+D3) and second vaccine dose (D2) amongst N-seronegative individuals by second dose vaccine type.
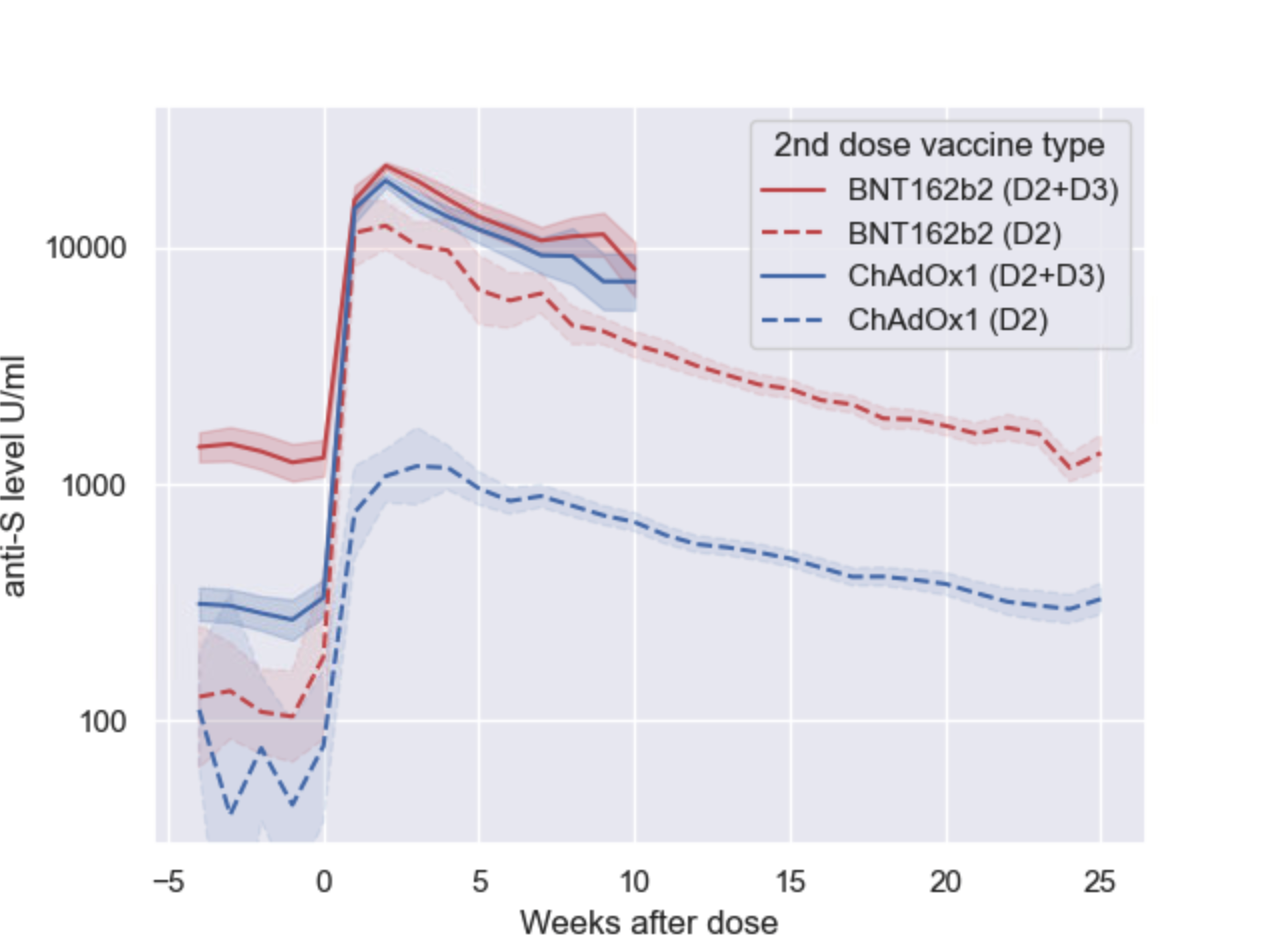
Figure 5. Anti-S levels (U/mL) over time since BNT162b2 booster dose amongst N-seronegative individuals by second dose vaccine type and age, sex and clinical risk group.
Please see this link for our full analysis.
4. Longer term antibody responses after SARs-CoV-2 infection
Regular antibody testing of the general population has been suggested as an option to monitor how SARs-CoV-2 case numbers change over time. A better understanding is needed about how antibody levels (nucleocapsid and spike) change after infection.
13,802 people in the Virus Watch study provided 58,770 valid capillary blood samples that were tested for both nucleocapsid (anti-N) and spike (anti-S) antibodies. Anti-N antibodies to SARS-CoV-2 indicate that an individual has previously been infected with SARS-CoV-2. Anti-S antibodies indicate that it’s likely an individual has either previously been infected with SARS-CoV-2 or that they have received a SARS-CoV-2 vaccine.
Antibodies are affected by time and to limit the effect of time on likelihood of an individual having a positive test, we looked at 537 people who had an antibody test within 269 days of their positive swab. To assess longevity of antibodies, we analysed the 2,046 test results from 596 individuals.
Of 537 individuals with a positive swab result, approximately 4 out 5 had a positive anti-N result. People aged 35-49 years old were more likely (Odds Ratio 1.98) to have a positive anti-N antibody result compared to people aged 18-34 years old.
Monitoring antibodies over time, anti-N levels peaked between days 90-119 after infection, but showed a decline after this date (Figure 6). This decline was more noticeable among females, when compared to males, and 18-49 year olds compared to 50 years and older.
In those who were unvaccinated, 244 samples from 124 individuals, anti-S detectability remained above 90% from days 30-269, with a relative decline in anti-N (Figure 7).
If vaccinated, the percentage of positive anti-N samples were generally lower throughout the follow up period but percentage of positive anti-S samples were higher (Figure 8).
Figure 6. Anti-N positivity and levels days post positive swab test, and then split by age groups.
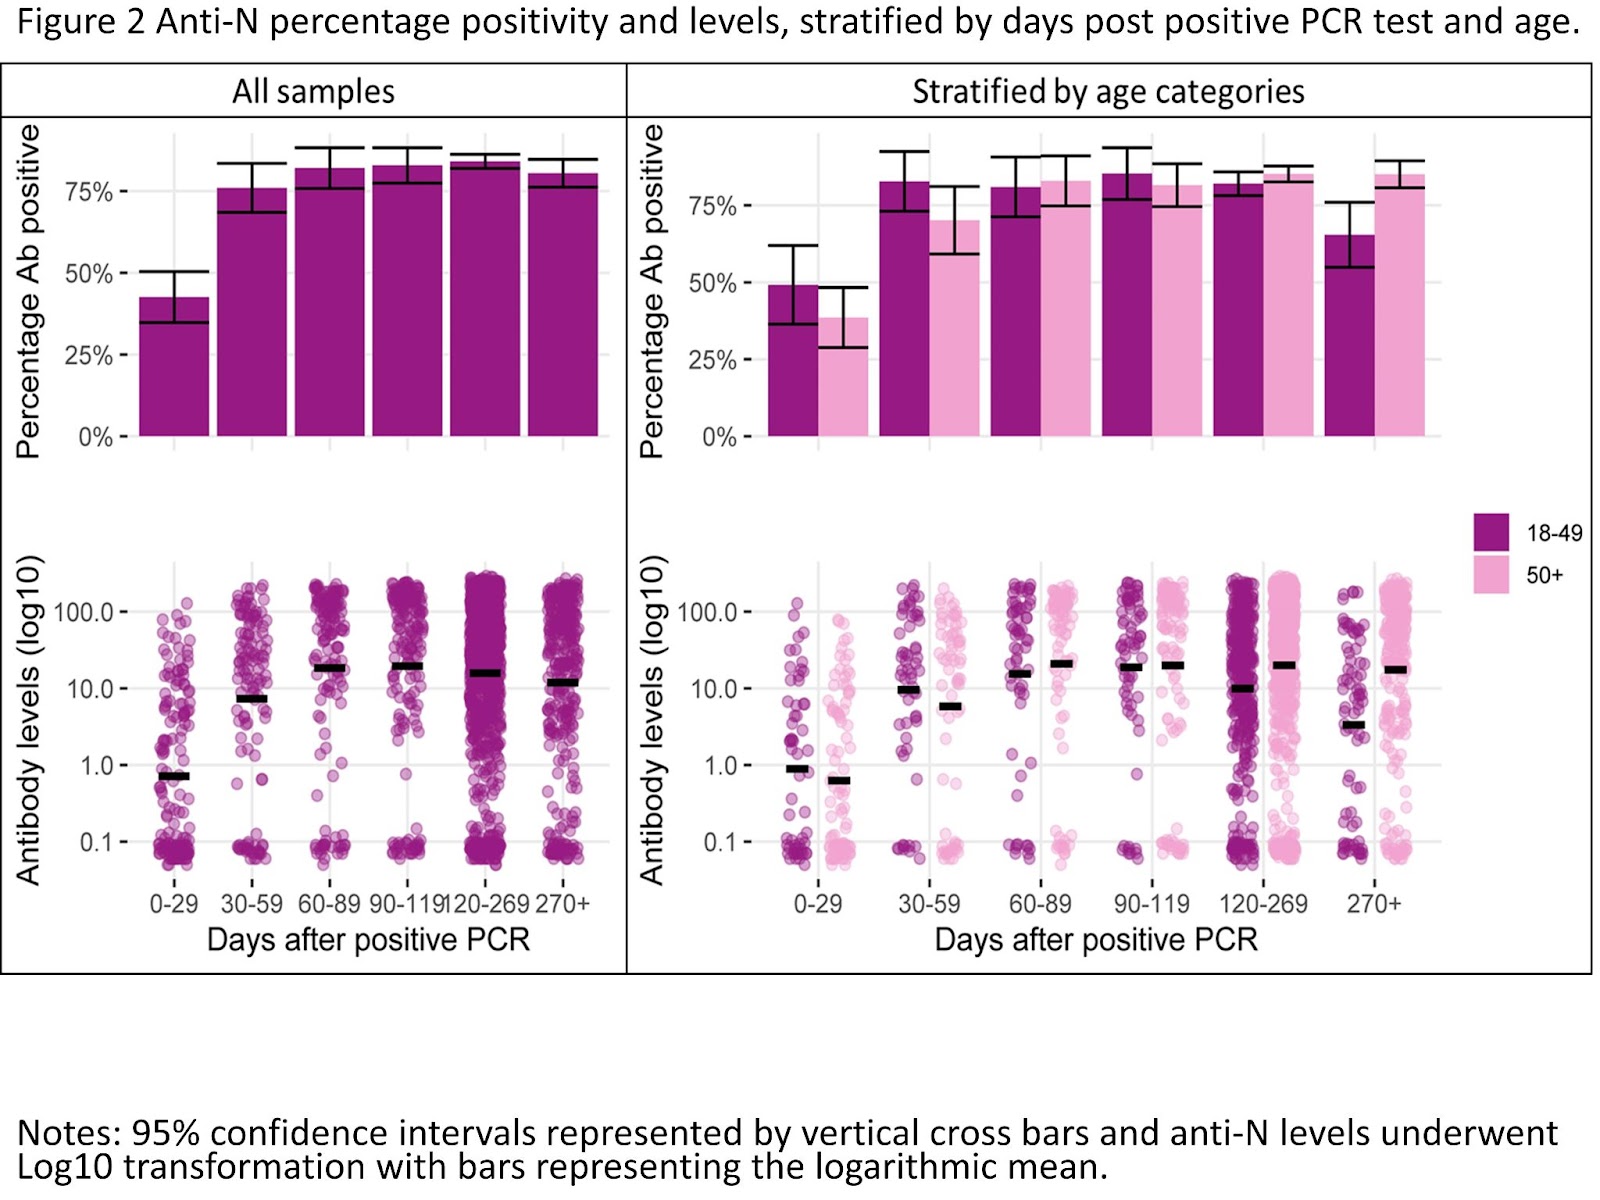
Figure 7. Percentage of positive anti-N and anti-S among unvaccinated.

Figure 8. Percentage of positive anti-N and anti-S split by if individuals were vaccinated before infection or had no prior vaccination.

Regular testing of antibodies may underestimate the true number of SARS-CoV-2 cases in the population as we found that only 4 out 5 individuals have a positive anti-N result despite previous swab confirmed SARS-CoV-2 infection. We also found that the duration of anti-N being detectable is affected by age and sex.
Please see this link for our full analysis.
5. Inequalities in access to paid sick leave among workers in England and Wales
It is poorly understood which workers lack access to sick pay in England and Wales. This evidence gap has been of particular interest in the context of the Covid-19 epidemic given the relationship between presenteeism and infectious disease transmission.
Using data on 8,874 workers in England and Wales who are participating in the Virus Watch study, we investigated which social and demographic groups were most likely to lack access to paid sick leave. We found 5,864 (66%) workers report having access to sick pay, 2,218 (25%) workers report no access to sick pay and 792 (8.9%) were unsure.
Workers aged 45-64 (Odds Ratio – OR 1.72) and over 65 (OR 5.26) are more likely to lack access to sick pay compared to workers aged 25-44. South Asian workers (OR 1.40) and those from Other minority ethnic backgrounds (OR 2.93) are more likely to lack access to sick pay compared to White British workers. Workers in low income households (OR 1.43-2.53) and those with manual labour and low-skill service sector occupations (OR 2.04-5.29) are also more likely to lack access to sick pay compared to those in high income households and managerial occupations.
The unwarranted age and race inequalities in access to sick pay this research reveals are suggestive of labour market discrimination. The occupational differences in access to sick pay are also cause for concern. Policymakers should consider expanding access to sick pay to mitigate transmission of Covid-19 and other endemic infectious disease epidemics in the community.
Please see this link for our full analysis.
6. Characteristics of households and individuals in Virus Watch
Virus Watch began recruiting people in June 2020 and as of 21st February 2022, 24,287 households and 58,678 people across England and Wales have joined the study (Table 1). 26,669 participants completed our latest weekly survey (Figure 9).
Table 1. Participants in Virus Watch, 21st February 2022.
| Characteristic | Virus Watch Participants | ONS (%)* |
| All | 58,678 | – |
| Age Group | ||
| 0-15 | 7,375 (13%) | 19% |
| 16-24 | 3,497 (6.0%) | 11% |
| 25-44 | 11,737 (20%) | 26% |
| 45-64 | 19,689 (34%) | 26% |
| 65+ | 16,380 (28%) | 19% |
| Sex | ||
| Male | 21,705 (37%) | 49% |
| Female | 27,531 (47%) | 51% |
| Missing/Prefer not to say | 9442 (16%) | – |
| Ethnicity | ||
| White British | 40,520 (69%) | 81% |
| White Irish | 671 (1%) | 1% |
| White Other | 2,817 (5%) | 4% |
| Mixed | 999 (2%) | 2% |
| South Asian | 2,728 (5%) | 5% |
| Other Asian | 427 (1%) | 2% |
| Black | 493 (1%) | 3% |
| Other Ethnicity | 288 (1%) | 1% |
| Prefer not to say | 194 (0.3%) | – |
| Missing | 9,541 (16%) | – |
| Region | ||
| North East | 2,534 (4%) | 5% |
| North West | 5,577 (10%) | 12% |
| Yorkshire and The Humber | 3,037 (5%) | 9% |
| East Midlands | 4,946 (8%) | 8% |
| West Midlands | 3,024 (5%) | 10% |
| East of England | 10,551 (18%) | 11% |
| London | 9,089 (15%) | 15% |
| South East | 9,851 (17%) | 15% |
| South West | 3,965 (7%) | 10% |
| Wales | 1,537 (3%) | 5% |
| Missing | 4,567 (8%) | – |
*ONS = Office for National Statistics. ONS data for age and region drawn from Mid-2019 Estimates of the Population for the UK, England, and Wales, Scotland and Northern Ireland (figures for England and Wales). ONS data for household size drawn from Families and Households in the UK 2019 (UK wide estimates).
Figure 9. Count of survey completions by week since the start of Virus Watch recruitment in June 2020.
