
Virus Watch preliminary findings on 21st June 2021
Virus Watch is a research study run by University College London and the NHS. Virus Watch aims to identify how SARS-CoV-2 spreads, and how to stop it. Findings so far presented on this page are early, preliminary results and should be interpreted with caution as they have not yet been peer-reviewed by scientists external to our research collaborators. We are presenting these early findings for participants, the general public and policy makers. A detailed description of the Virus Watch study and our research questions can be found in our study protocol. Virus Watch began recruiting people in June 2020 and as of 21st June 2021, 24,315 households and 50,759 people across England and Wales have joined the study. You can read more about the characteristics of people taking part in Virus Watch here.
Table of contents
- Summary of findings
- Interpretation of findings
- Where do you think you caught Covid-19?
- Changes in mobility after a COVID-19 vaccination using GPS movement tracking data from a mobile phone app
- Persistent symptoms (long COVID) in children
1. Summary of findings:
Where do you think you caught Covid-19?
- We have examined the perceived relative importance of different settings for COVID-19 transmission.
- In descending order of frequency, the perceived setting of where someone believed they caught COVID-19 was: home (33%), workplace (23%), an essential shop e.g. grocery store (18%), other venues (11%), a leisure venue e.g. restaurant (10%), a place of education (8%), healthcare settings (8%), public transport (7%), and someone else’s home (6%).
- The most important perceived venue varied by age group: place of education was more important than home for children aged 0-17, home and workplace were of similar importance for working age adults, and home and essential shops were the most important settings for those aged over 65 years.
- Home settings had a relatively stable level of perceived importance between March-May 2020 (34%) and Jan-March 2021 (30%).
- The proportions who perceived that they were infected in someone else’s home increased over time with 0% in March-May 2020 compared to 9% in Jan-March 2021.
- People who knew they had been in contact with a COVID-19 case were more likely to report catching COVID-19 at home or work.
- People with no known contact were more likely to report catching COVID in public places such as shops.
Changes in mobility after a COVID-19 vaccination using GPS movement tracking data from a mobile phone app
- Mobile phone global position system (GPS) data was collected from study participants that consented and voluntarily downloaded ArcGIS Tracker App onto their mobile phones.
- Of the 13,120 people invited to the Tracker mobile phone app sub-study of the Virus Watch, 2,193 downloaded the app onto their phone and contributed at least 1 GPS reading.
- After removing people with fewer than 5 data points either side of their vaccination date, 228 people were included in our analysis.
- In the 154 days prior to vaccination the median daily travel distance was 8.9km. Between the day of vaccination until 100 days after vaccination, the median daily travel distance increased to 10.3km.
- Restricting the travel and vaccination events to those that occurred during the third national lockdown (4th of January 2021 to the 5th of April 2021) we found that prior to vaccination there was a median daily movement increase of 9m. In the following 30 days vaccination there was a median daily movement increase of 10m.
- Our analysis of changes in movement post vaccination were consistent with both a median daily reduction of 60m and an increase of 175m per day.
Prevalence of persistent symptoms in children (long COVID)
- We investigated how common long COVID (persistent symptoms lasting 4 weeks or more) is among 4678 children participating in Virus Watch.
- 175 cohort children (3.7%) had evidence of past or present COVID-19.
- 4.6% of children with a history of COVID-19 had persistent symptoms lasting 4 weeks or more.
- 1.7% of all children had persistent symptoms.
- Teenagers, girls and children who had a long-term condition such as asthma were more likely to have persistent symptoms.
- The most common type of persistent symptoms reported were ‘general symptoms,’ including fatigue.
You can find our previous findings on the link below.
- Preliminary findings November 2020
- Preliminary findings January 2021
- Preliminary findings March 2021
- Preliminary findings May 2021
2. Interpretation of findings
Where do you think you caught Covid-19?
Our findings illustrate the importance of home, work and place of education as venues for the spread of COVID-19. The relative importance of different settings is likely to change over time and with variation in restrictions. In future waves of transmission, these findings can support public health efforts on guidance to prevent household transmission, advice on working from home, restrictions in different venues.
Changes in mobility pre and post first COVID-19 vaccination
Our results require cautious interpretation as they are consistent with both an increase and decrease in movement after vaccination and suggest that any change in mobility post vaccination is likely to be modest. Other studies have suggested that people increase their number of non-household contacts after their first vaccination dose and so further research on people’s behaviour following vaccination is warranted. In the meantime, it is important that public health communications are clear about the differential protection against SARS-CoV-2 infection offered by the first and second doses of the vaccine, such that people can exercise sound personal judgement on how they alter behaviour change following vaccination.
Prevalence of persistent symptoms in children (long COVID)
The risk of reporting persistent symptoms was twice as high in children who had tested positive for COVID-19 virus than in children who had not, although the actual proportion of children reporting persistent symptoms was low. Our results are similar to those reported via the Zoe app, but lower than those reported by ONS.
3. Where do you think you caught Covid-19?
Risk of spread of COVID-19 is understood to be driven by a complex range of factors found in different settings. Estimating the relative contribution of different settings to the overall spread of the virus is challenging. We aimed to examine the perceived relative importance of different settings for COVID-19 transmission by asking participants in Virus Watch that had self-reported a positive SARS-CoV2 test, whether they had been in contact with another case and where they thought they had caught COVID-19.
1142 participants had self-reported a positive COVID-19 test. 499 (44%) reported coming into contact with a confirmed case, 120 (10%) contact with a suspected case and 523 (46%) reported no known contact.
Amongst all cases, the perceived setting of acquisition overall was, in descending order of frequency, within the home (n=317, 33%), at work (n=259, 23%), in an essential shop (n=201, 18%), other venues (n=129, 11%), in a leisure venue (n=112, 10%), in a place of education (n=96, 8%), in healthcare settings (n=90, 8%), on public transport (n=75, 7%), and in someone else’s home (n=64, 6%). This varied considerably by whether or not the person was a contact of a known case or not (Figure 1).
Figure 1. Perceived Setting of SARS-CoV2 Acquisition by Contact Status.
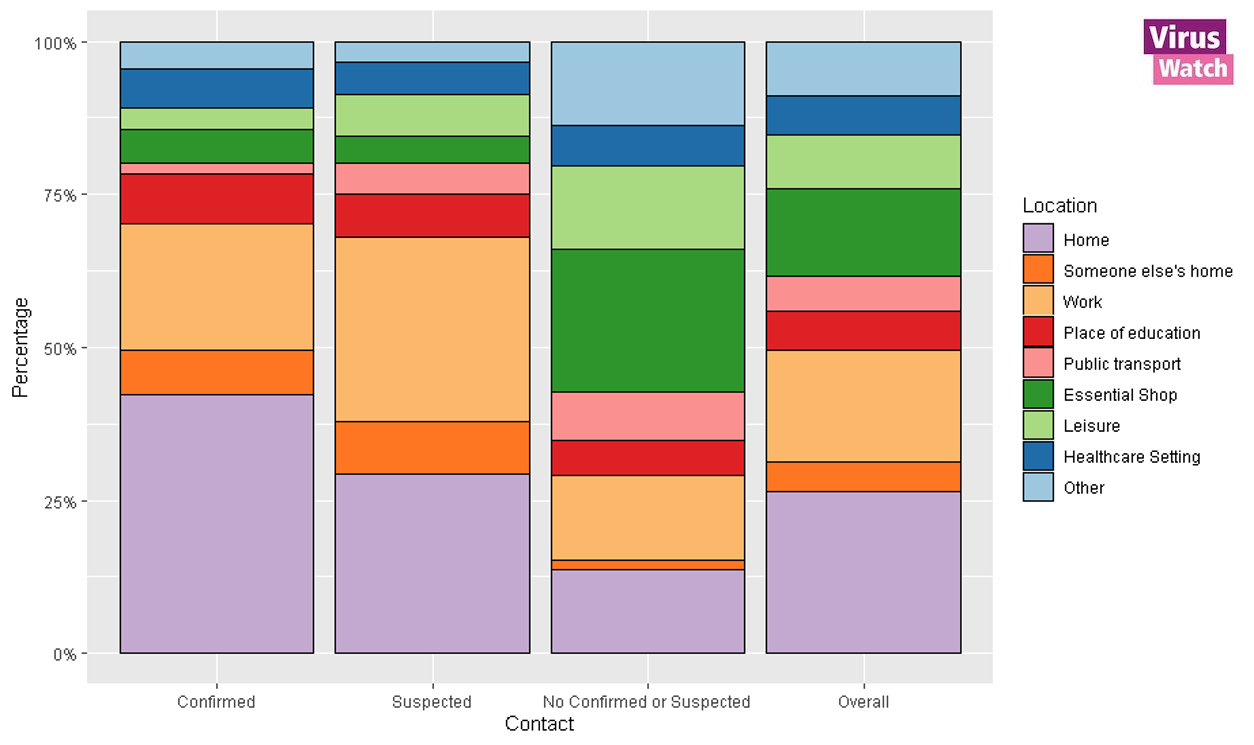
Note:
- All results are provisional and subject to revision.
- These statistics refer to cases reported by Virus Watch participants in the community.
- Participants could select multiple locations so proportions are calculated from a group (n) may sum to >100.0%
Home settings had a relatively stable level of perceived importance between March-May 2020 (n=21, 34%) and Jan-March 2021 (n=106, 30%; Figure 2). The proportions who perceived that they were infected in someone else’s home increased over time (n=0, 0% March-May 2020 vs. n=27, 9% Jan-March 2021), as did place of education (n=0, 0% vs. n=12, 4%). The proportion who perceived that they were infected in a healthcare setting decreased over time (n=18, 26% vs. n=25, 8%). Caution should be used interpreting these time period changes because of small numbers for some groups, particularly in the Jun-Aug time period when levels of infection were low.
Figure 2. Perceived Setting of SARS-CoV2 Acquisition by Time Period.
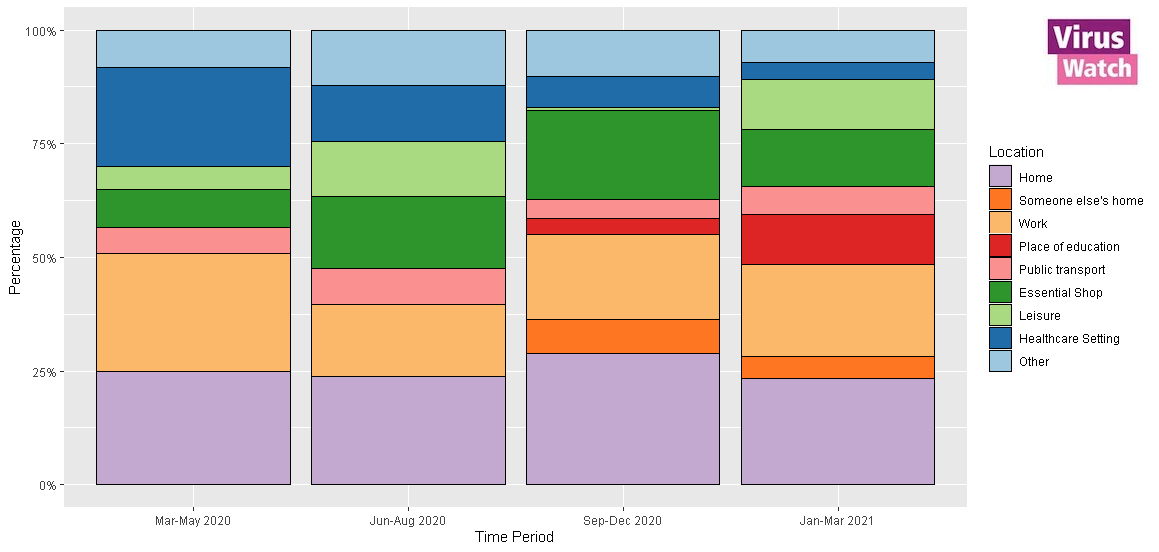
Notes:
- All results are provisional and subject to revision.
- These statistics refer to cases reported by Virus Watch participants in the community.
- Participants could select multiple locations so proportions are calculated from a group (n) may sum to >100.0%
The most important perceived venue for transmission varied by age group: place of education was more important than home for children aged 0-17, home and workplace were of similar importance for working age adults, and home and essential shops were the most important settings for those aged over 65 years (Figure 3). Young adults aged 18-34 were more likely than other age groups to perceive leisure venues and public transport as the venue of acquisition.
Figure 3. Perceived Setting of SARS-CoV2 Acquisition by Age.

Note:
- All results are provisional and subject to revision.
- These statistics refer to cases reported by Virus Watch participants in the community.
- Participants could select multiple locations so proportions are calculated from a group (n) may sum to >100.0%
Our study was reliant on community testing to identify cases and therefore our results are most likely to represent infections acquired after the first UK lockdown following initiation of the Test, Trace and Isolate programme.
Our findings illustrate that home, work and place of education were perceived as key venues for the spread of COVID-19. The perceived importance of different settings is likely to change over time and with variation in restrictions. Perceived importance of different venues varied by age, with place of education most important in children, and essential shopping of high importance in older adults. Home was perceived as an important location across time periods and age groups – particularly for contacts of confirmed or suspected cases – highlighting the importance of further research and public health advice to reduce spread of SARS-CoV-2 in households. Our estimates cover several periods of intense public health restrictions in the UK. As restrictions loosen, the relative importance of out-of-household spread, including in workplaces and a wider range of leisure settings, is likely to increase.
Please see this link for our full analysis.
4. Changes in mobility pre and post first SARS-CoV-2 vaccination
The UK response to the COVID-19 pandemic has included restrictions on non-essential movement in order to reduce the number of contacts between people, which has contributed to controlling transmission of the virus. Understanding movement post-first vaccination is important as it could help policy makers understand how perceived protection from the vaccination programme may offset the effectiveness of other policies designed to reduce the spread of COVID-19. We aimed to quantify the effect that the first vaccination dose has on travelling behaviour using mobile phone global position system data collected from study participants that consented and voluntarily downloaded ArcGIS Tracker App onto their mobile phones.
Of the 13,120 people invited to the Tracker mobile phone sub-cohort of the Virus Watch, 2,193 participants contributed at least 1 GPS reading. We removed invalid data points including those outside of England, and those which did not contain accurate readings (within 25 horizontal metres). We also removed individuals with fewer than 5 data points either side of their vaccination date.
228 individuals were included in the final analysis and between 157 days prior to vaccination until the day before vaccination, the average daily travel distance was 8.9km. Between the day of vaccination until 100 days after vaccination, the average daily travel distance was 10.30km.
We examined the rate of change in movement in people before and after vaccination. Prior to vaccination, we found a median decrease of 40m of movement per-day. After vaccination, there was a median increase of 114m in movement per-day. (Figure 4).
Figure 4: Graphical representation of the increase in the median rate change in movement after vaccination.
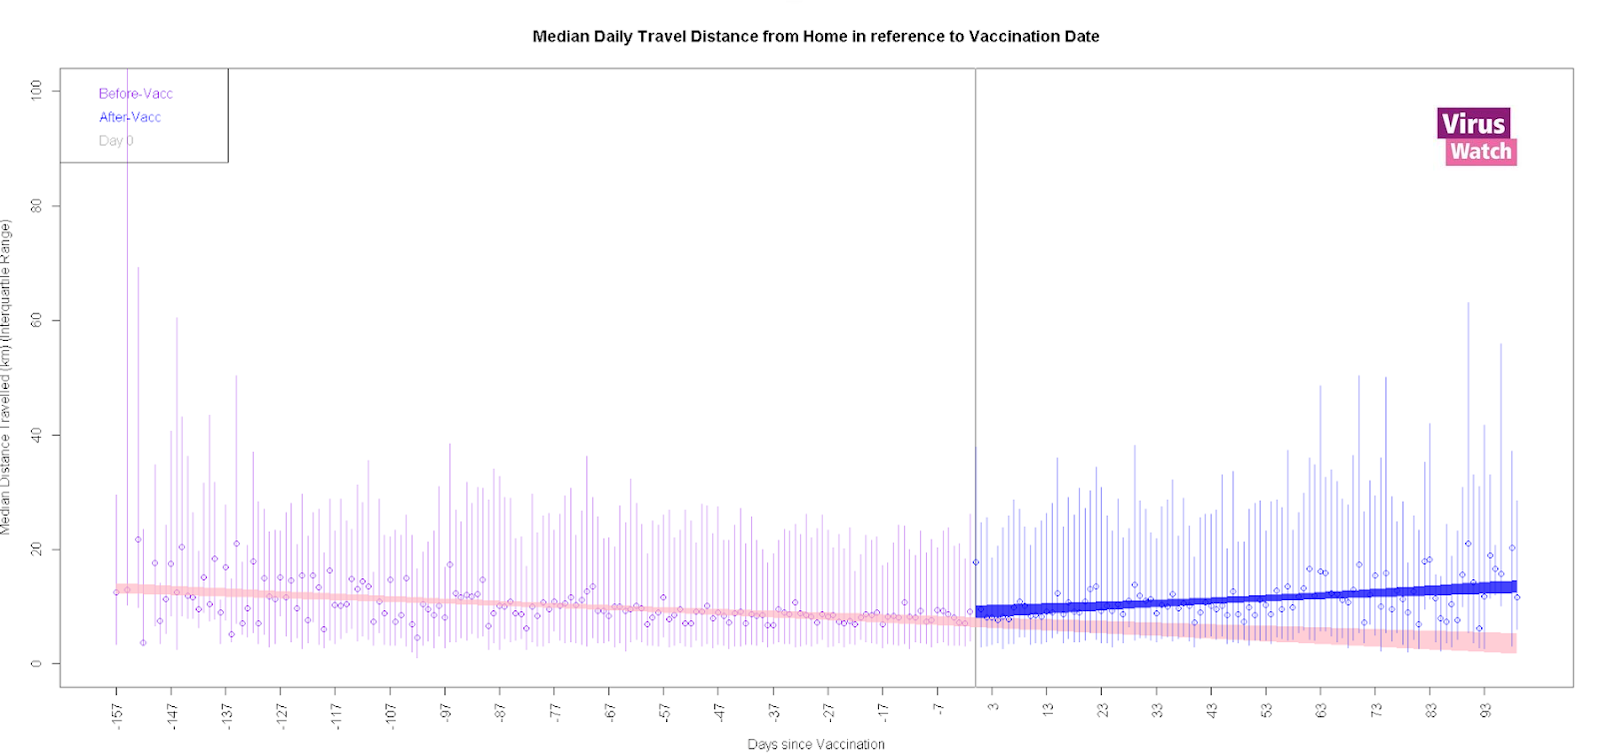
Notes:
- All results are provisional and subject to revision.
- These statistics refer to cases reported by Virus Watch participants in the community.
As our analysis was conducted at a time when there was an easing in national restrictions on movement, the removal of these restrictions could provide an alternative explanation for any differences in movement after vaccination we found. To explore this issue, we conducted a sensitivity analysis which limited travel and vaccination events to the third national lockdown between 4th of January 2021 to the 5th of April 2021.
In this analysis, prior to vaccination, there was a median daily movement increase of 9m. For the 30 days after vaccination, there was a median daily movement increase of 10m (Figure 5).
Figure 5: Graphical representation of the increase in the median rate change in movement after vaccination during the 3rd national lockdown (4th January 2021 – 5th April 2021) with a 30 day period either side of the vaccination date.
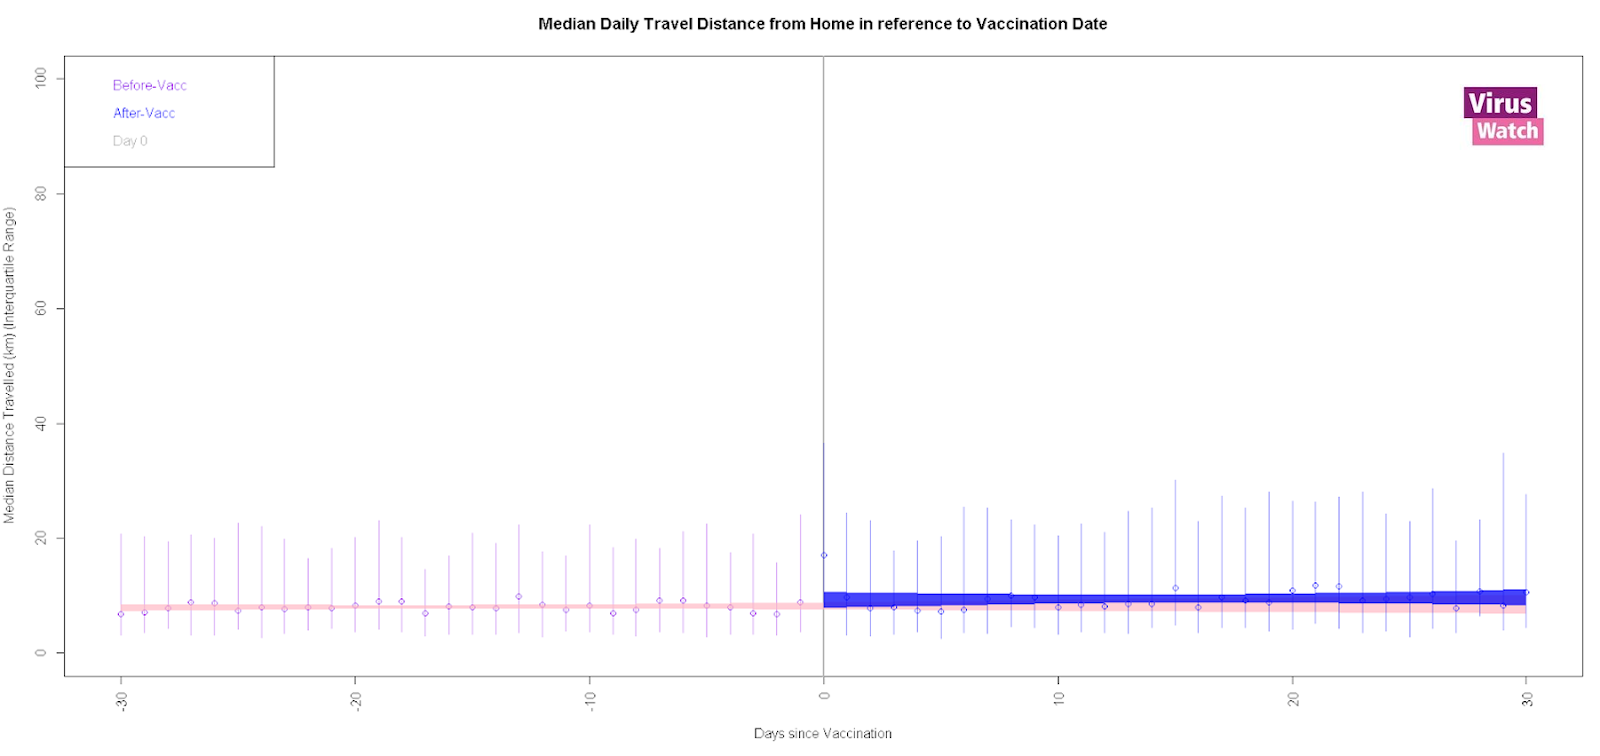
Notes:
- All results are provisional and subject to revision.
- These statistics refer to cases reported by Virus Watch participants in the community.
Across all of our analyses, we found changes in movement post vaccination that were consistent with both a median daily reduction of 60m and an increase of 175m per day. On balance, our results do not provide evidence that people increase the rate of their movements following first dose vaccination as they are consistent with both an increase and decrease in movement after vaccination and suggest that any change in mobility post vaccination is likely to be modest. Given previous studies have suggested people increase their non-household contacts after their first vaccination dose, further research on behaviour change following vaccination is warranted. In the meantime, we believe that increased efforts should be made to provide clear public health communications about incomplete protection following the first dose and the need to exercise caution until after the second dose has had time to produce high levels of protection against COVID-19.
Please see this link for our full analysis.
5. Prevalence of persistent symptoms in children (long COVID)
There have been several reports of persistent symptoms (also known as ‘long covid’) among adults who have had COVID-19 disease. There are few studies of how common these symptoms are in children. We investigated how common persistent symptoms (those lasting 4 weeks or more) were among children participating in Virus Watch. We looked at whether these symptoms were more common among children who had had a COVID-19 infection.
We used Virus Watch data from 4678 children aged less than 18 years. 175 cohort children (3.7%) had evidence of past or present COVID-19. Overall, 1.7% of children had persistent symptoms, which increased to 4.6% of children with a history of COVID-19 infection. Teenagers, girls and children who had a long-term condition such as asthma were more likely to have persistent symptoms. The most common type of persistent symptoms reported was ‘general symptoms,’ including fatigue (Figure 6).
Figure 6. Type of symptoms in 80 children who reported persistent symptoms

We were not able to examine the prevalence of symptoms among children who have been admitted to hospital with COVID-19 disease. We also could not look at how common these persistent symptoms are after other infections in children, such as influenza. We are working on estimating what proportion of adults develop persistent symptoms after COVID-19 infection.