
Virus Watch preliminary findings on 20th Dec 2021
Virus Watch is a research study run by University College London and the NHS. The study aims to identify how COVID-19 spreads, and how to stop it. Findings so far presented on this page are early, preliminary results and should be interpreted with caution as they have not yet been peer-reviewed by scientists external to our research collaborators. We are presenting these early findings for participants, the general public and policy makers. A detailed description of the Virus Watch study and our research questions can be found in our study protocol. Virus Watch began recruiting people in June 2020 and as of 20th Dec 2021, 24,287 households and 58,233 people across England and Wales have joined the study.
Table of contents
- Summary of findings
- Interpretation of findings
- Implications
- Antibody levels after two doses of vaccine and risk of SARS-CoV-2 infection
- Risk of SARS-CoV-2 Infection by Occupation
- Workplace Contact Patterns in England during the COVID-19 Pandemic
- Relative contribution of non-household activities on risk of acquiring COVID-19 infection
- Characteristics of households and individuals in Virus Watch
1. Summary of findings:
Antibody levels after two doses of vaccine and risk of SARS-CoV-2 infection
- A range of studies have found that the effectiveness of SARS-CoV-2 vaccines reduces over time. Antibody levels to the virus may predict the risk of being infected after having the vaccine, but current evidence on this is limited.
- Three weeks after the second dose, average antibody levels were 9039 (95%CI: 7946-10905) U/ml for people who received the Pfizer–BioNTech vaccine, and 1025 (95%CI: 917-1146) U/ml for Oxford-AstraZeneca. Antibody levels then decreased at a similar rate for both vaccines. We found that people with antibody levels greater than 500 U/ml were around half as likely to have an infection compared to those with antibody levels below this. Because those with Oxford-AstraZeneca started at lower antibody levels they reached the 500 U/ml level sooner than those vaccinated with the Pfizer–BioNTech vaccine.
- People vaccinated with Oxford-AstraZeneca had a greater risk of an infection compared to those vaccinated with Pfizer–BioNTech.
- The study could not investigate whether or not waning immunity reduced protection against severe disease.
Relative contribution of non-household activities on risk of acquiring COVID-19 infection during the second wave of the pandemic
- While transmission of COVID-19 can occur in any setting, it can be difficult to work out which settings contribute most to transmission.
- During the second wave of the pandemic when there were intense restrictions on mixing and work from home advice, going shopping or using public or shared transport more than once a week each nearly doubled the chance of catching COVID-19, while leaving home for work or education increased the chance of catching COVID-19 by nearly one third.
- Shopping, mainly for essential goods, accounted for the greatest proportion of infections (35%) caught outside the household during the second wave. This is partly because it was undertaken more frequently by more people than other activities outside the house. Public or shared transport and going into work were also important, but because many people were often working from home and not using public or shared transport these activities accounted for a lower number of infections than shopping during this period.
- Other non household activities were highly restricted during this period so accounted for very little transmission.
- The relative importance of different activities is likely to have changed since restrictions were lifted.
Changes in frequency of non-household activities and exposures in different settings
- When we compared weekday non household activities in March 2021 (a period of intense restrictions) and November 2021 (a period of no restrictions) we saw marked increases in frequency of use of a wide variety of settings including public transport, eating out, going to pubs, theatres, cinemas, sports activities and parties.
- These settings also had high intensity of exposure to shared airspaces and, to a lesser extent, close contact.
- Parties were notable for having both high exposure to shared airspace and high levels of close contact.
Risk of SARS-CoV-2 Infection by Occupation
- We found the job you do makes an important difference to your risk of COVID-19 infection.
- Compared to office-based professional occupations, healthcare, teaching/education/childcare, indoor trade and process/plant (factory), and leisure and personal service occupations had higher risks of COVID-19 infection.
- For most of these higher risk occupations the increased risk was in the first two waves of the pandemic but teachers also stayed at higher risk during the third wave.
Workplace Contact Patterns in England during the COVID-19 Pandemic
- Because the work you do affects your risk of COVID-19 we wanted to explore how working from home, workplace contacts, shared airspace and mask use varied by occupation at different times in the pandemic. Trade occupations were most likely to attend the workplace throughout the pandemic, and office-based professional occupations least likely. Workers in leisure and service occupations became more likely to go into work from April 2021, when many workplaces reopened. Office based occupations continued to work mainly from home even after easing of restrictions.
- Education and healthcare workers tended to share the workspace with a higher number of people and to have more close contacts than most other occupations. Education workers were also much less likely to wear masks during close contact.
You can find our previous findings on the link below.
- Preliminary findings November 2020
- Preliminary findings January 2021
- Preliminary findings March 2021
- Preliminary findings May 2021
- Preliminary findings June 2021
2. Interpretation of findings
- We show that waning antibody levels following vaccination contribute to decreased immunity over time and that breakthrough infections are more likely in those vaccinated with AstraZeneca vaccine who tend to have lower antibody levels than those vaccinated with Pfizer. The elderly and clinically vulnerable were vaccinated first so have had the most time for antibodies to wane. Other research shows that booster (third) doses of m-RNA vaccines (either Pfizer or Moderna) can get antibody levels up to high levels again, regardless of which vaccine was used for the first two doses.
- During the second wave of the pandemic when there were intense restrictions most Virus Watch participants worked from home and did not use public or shared transport, but almost everyone used essential shops. Across our participants shops were therefore a more important source of transmission than either work or public transport use. We did not see much evidence of transmission in other settings like pubs, restaurants and theatres during the second wave of the pandemic because, for much of the time these venues were closed.
- The level of exposure to shared airspace and close contacts increased a lot during the third wave of the pandemic compared to in March 2021, particularly in settings including public transport, eating out, going to pubs, theatres, cinemas, sports activities and parties.
- Jobs where it is difficult to work from home and where you are more likely to share airspace and have close contact with others tended to have higher risk of COVID-19 than other occupations through the first two waves of the pandemic. Most of these occupational differences in risk became much less marked in the third wave of the pandemic as non-work-based mixing increased.
- The lower risk in healthcare workers during the third pandemic wave likely reflects booster doses of the vaccine.
- The continued higher risk in teachers likely reflects high levels of infection in children and transmission in schools, where there are high levels of close contact, shared airspace and low use of masks.
3. Implications
- The risk of COVID-19 infection is a balance between population levels of immunity and population mixing.
- Our analyses show the importance of boosting vaccine-based immunity to counteract drops in antibody levels.
- Our analyses also show how the jobs people do, the activities they undertake outside the household and restrictions and advice make important differences to how COVID-19 spreads.
- The emergence of the Omicron variant has made boosting of immunity and reduction of transmission even more important.
- The information Virus Watch participants help us to generate is regularly fed into scientific advisory groups to inform the national COVID-19 response.
Detailed Findings
4. Antibody levels after two doses of vaccine and risk of SARS-CoV-2 infection
A range of studies globally have found that the effectiveness of SARS-CoV-2 vaccines wane over time. Antibodies targeting the virus’s spike protein may predict the risk of breakthrough infection, but current evidence on this is limited.
In this analysis we examined how antibody waning varies by vaccine type, demographic and clinical characteristics and whether antibody levels can predict the risk of breakthrough infection. We also examined whether vaccine type affects the chances of developing COVID-19 after receiving two vaccine doses.
We included 24049 antibody samples from 8858 people that had not been infected with COVID-19. 5549 people (63%; 5549/8858) who received a second dose of Oxford-AstraZeneca and 3205 who received a second dose Pfizer–BioNTech (36%; 3205/8858) were included in our analyses.
The peak antibody level occurred two to three weeks after the second dose of vaccine (Figure 1). For Pfizer/BioNTech, the average anti-S levels at three weeks was 9039 (95%CI: 7946-10905) U/ml and for Oxford-AstraZeneca was 1025 (95%CI: 917-1146) U/ml. At 20 weeks after the second dose of vaccine, the mean anti-S levels were 1521 (95%CI: 1432-1616) U/ml for Pfizer–BioNTech and 342 (95%CI: 322-365) U/ml for Oxford-AstraZeneca.
Figure 1. Geometric mean (with 95% confidence intervals) for anti-S levels (U/ml) over time since second dose of vaccination, and levels predicted by a linear mixed effect model amongst N-seronegative individuals by vaccine type.
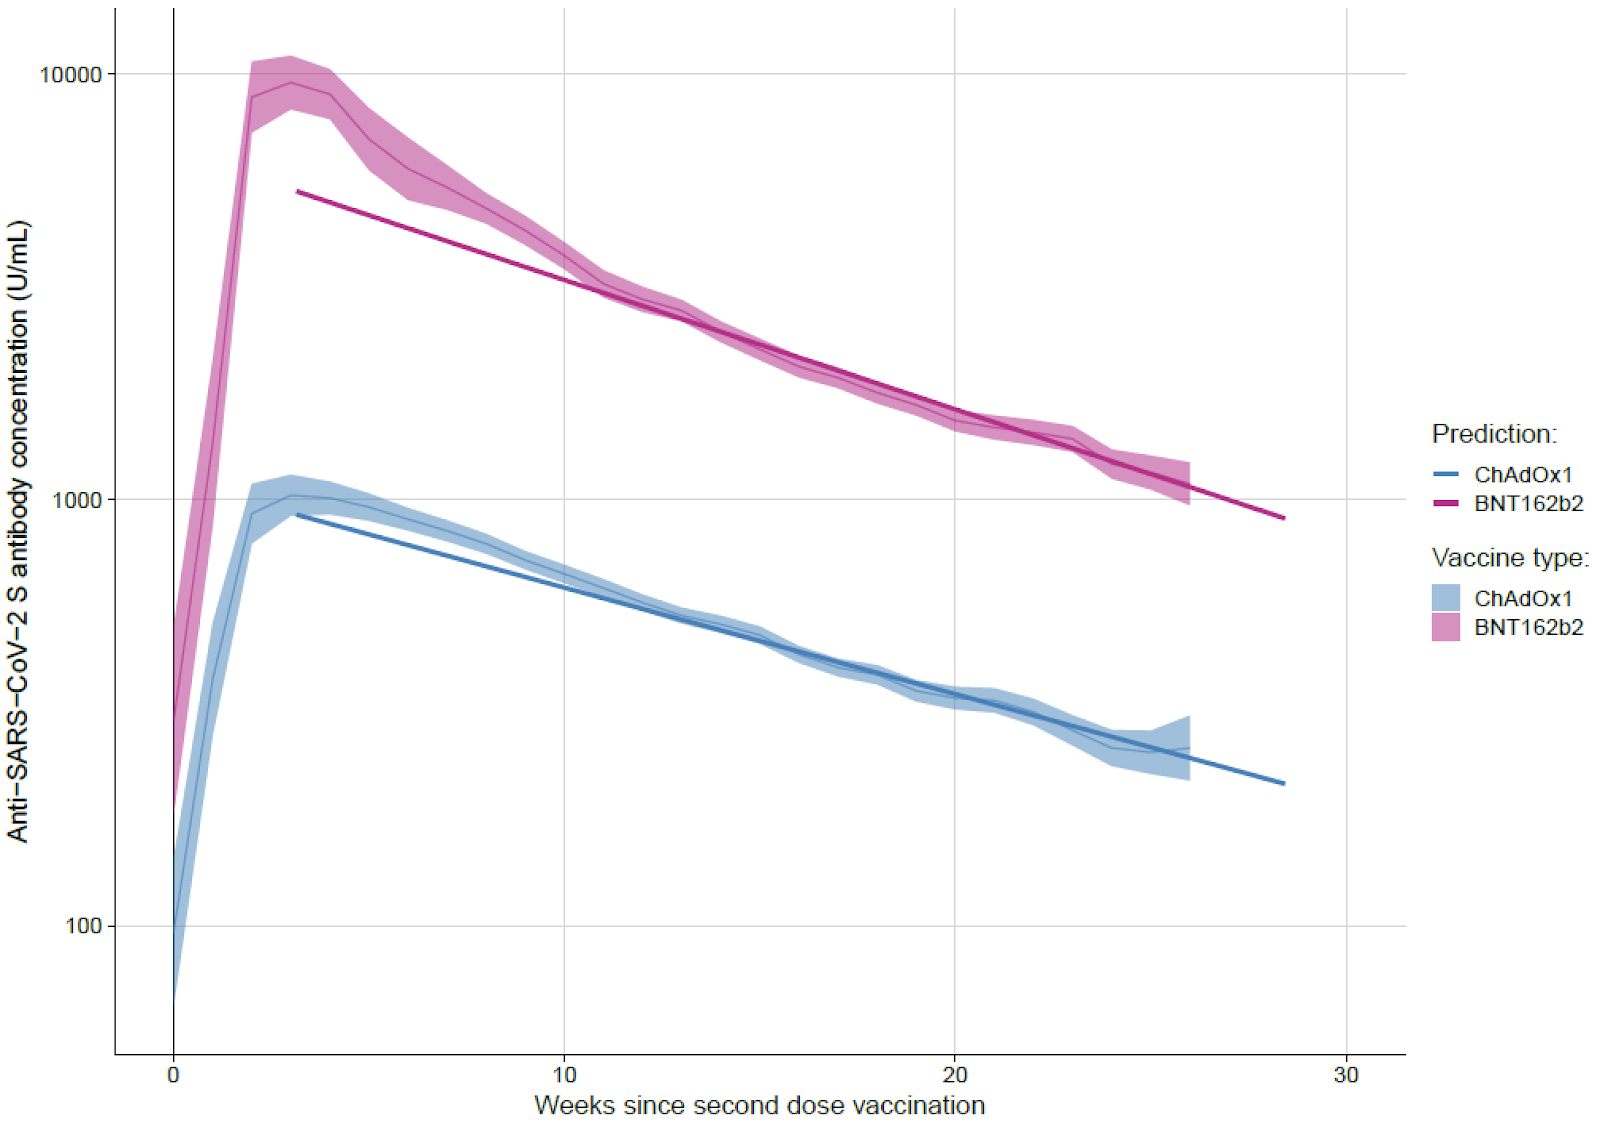
Note:
- All results are provisional and subject to revision.
- These statistics refer to cases reported by Virus Watch participants in the community.
- Predicted levels are the results from a linear mixed effect model with a random intercept (to account for repeated samples for each participant) to antibody level data in natural log space 21 days post second vaccination dose.
Twenty weeks after the second dose of vaccine, mean BNT162b2 anti-S levels were 1741 (95%CI: 1570-1931) U/ml in 18-64 year olds and 1418 (95%CI: 1317-1527) U/ml in participants over 65 years of age (Figure 2). Anti-S levels at 20 weeks post second dose of ChAdOx1 were 351 (95%CI: 320-385) U/ml in 18-64 year olds and 335 (95%CI: 308-365) U/ml in participants over 65 years of age. There was no evidence of a difference in the rates of waning by age, sex or clinical risk group for Pfizer/BioNTech or Oxford-AstraZeneca.
Figure 2. Geometric mean (with 95% confidence intervals) for anti-S levels (U/ml) over time since second dose of vaccination, and levels predicted by a linear mixed effect model amongst N-seronegative individuals by vaccine type and sex, age and clinical risk group.

Note:
- All results are provisional and subject to revision.
- These statistics refer to cases reported by Virus Watch participants in the community.
- Predicted levels are the results from a linear mixed effect model with a random intercept (to account for repeated samples for each participant) to antibody level data in natural log space 21 days post second vaccination dose.
- Different y-axis scales for BNT162b2 and ChAdOx1)
8,275 individuals were included in an analysis of antibody levels prior to breakthrough infection in order to examine levels as measure of risk of protection against infection and estimate a predicted time to reach a specified anti-S level for a threshold of protection. Individuals with anti-spike levels greater than 500 U/ml are around half as likely to have a breakthrough infection compared to those with anti-spike levels below this level.
We identified 673 breakthrough infection cases occurring between 17th March 2021 and 24th October 2021 in the full Virus Watch cohort and using these data we found an increased risk of a breakthrough infection for those who received the Oxford-AstraZeneca compared to those who received Pfizer–BioNTech (adjusted Odds Ratio: 1.43, 95% CIs: 1.18-1.73, p<0.001).
Please see this link for our full analysis.
5. Risk factors for acquiring COVID-19 infection outside the household
While transmission of COVID-19 can occur in any setting where the infection is present, understanding the relative importance of which setting contributes most to transmission of COVID-19 has been difficult to assess. We aimed to understand the relative importance of different activities and settings in the transmission of COVID-19 during the second wave of the pandemic.
We did this by looking at how many participants in Virus Watch had a positive SARS-CoV2 test or how many had a positive antibody test result indicating that they had previously been infected with COVID-19. We only included positive test results that we could say with a strong likelihood meant that the participant had been infected with COVID-19 between October 2020 and May 2021. We only included participants who we could identify were infected outside the house, using information about who was the first in the household to develop symptoms or who was first to test positive. For the same time period, we asked participants about the activities they undertook and the different settings that they visited.
Out of 10,475 Virus Watch participants who answered questions about their activities and settings visited during the second wave and had results of antibody tests, 874 (8%) participants became infected with COVID-19 outside the house. The highest level of infection was seen in working-aged adults (12%), women (10%), those from poorer areas (11%), non-white ethnic groups (up to 13%), those living in London (14%) and the un-vaccinated (14%).
The main activities undertaken which increased the risk of being infected with COVID-19 outside of the home were using any form of public or shared transport more than once a week (which increased the risk of infection by over 80%), shopping more than once a week (increased risk by 70%) and leaving home to go to work or education at least once per week (increased risk by 20%). The increased risk of COVID-19 transmission at work is strongly influenced by the number of close contacts within the work place and using public transport to get there.
Among all cases of COVID-19 that were estimated to have occurred outside the household, leaving home for work or education accounted for 7%, using public or shared transport accounted for 12%, while shopping accounted for 35% of COVID-19 infections picked up outside the home.
As this study examined activities undertaken and venues visited during a period of tight restrictions and closures of many hospitality or leisure venues, we could not ascertain the risk related to going to these settings. This suggests that regulations restricting their use were effective in reducing transmission of COVID-19.
Our findings suggest that during periods when there is growing spread of COVID-19, transmission could be significantly reduced by supporting people to work from home, making it easier to use active transport such as cycling or walking to work in those who do need to go to work, and increasing capacity for people to shop for essential goods online.
Our estimates cover a period of intense public health restrictions in the UK. Restrictions eased after the period of this study and many people returned to workplaces and started visiting a wider range of hospitality and leisure settings. The relative importance of which settings outside the home increase the risk of catching COVID-19 is likely to change as people increased their contacts. We will continue to assess which activities and settings contribute to the greatest spread of COVID-19 during these recent times of more social contact.
Please see this link for our full analysis.
6 Contact Risk by Setting: Virus Watch Contact Diaries for March versus November 2021
Contact diaries were completed by adults (≥16) corresponding to Monday March 19 (during third national lockdown) and Monday November 29, 2021. These involved selecting all the settings where you spent time on the diary day, and then providing some further detail about contact in that setting. Please see the link in Section 8 for more information about the contact diaries.
When we compared weekday non household activities in March 2021 (a period of intense restrictions) and November 2021 (a period of no restrictions) we saw marked increases in frequency of use of a wide variety of settings including public transport, eating out, going to pubs, theatres, cinemas, sports activities and parties.
These settings also had high intensity of exposure to shared airspaces and, to a lesser extent, close contact. Parties were notable for having both high exposure to shared airspace and high levels of close contact.
Table 1. Proportion of Participants Reporting Time Spent in Each Location
| March 2021 N = 10,9581 | November 2021N = 9,7331 | |
| Home | 10,212 (93%) | 8,611 (88%) |
| Essential Shop | 2,304 (21%) | 2,794 (29%) |
| Outside | 3,195 (29%) | 2,483 (26%) |
| Car/Taxi | 1,302 (12%) | 2,287 (23%) |
| Work | 1,550 (14%) | 1,634 (17%) |
| Someone Else’s Home | 408 (3.7%) | 1,048 (11%) |
| Eating Out | 13 (0.1%) | 983 (10%) |
| Non-Essential Shop | 125 (1.1%) | 929 (9.5%) |
| Exercise/Sports | 21 (0.2%) | 739 (7.6%) |
| Healthcare Setting | 586 (5.3%) | 670 (6.9%) |
| Other Indoor Location(s) | 177 (1.6%) | 593 (6.1%) |
| Pub/Bar/Club | 2 (<0.1%) | 337 (3.5%) |
| Education | 261 (2.4%) | 259 (2.7%) |
| Personal Care | 10 (<0.1%) | 150 (1.5%) |
| Place of Worship | 58 (0.5%) | 139 (1.4%) |
| Cinema/Theatre/Sports Event | 1 (<0.1%) | 124 (1.3%) |
| Party | 1 (<0.1%) | 19 (0.2%) |
| 1n (%) |
Figure 3. Maximum Number of People in Shared Space (excl. household members)
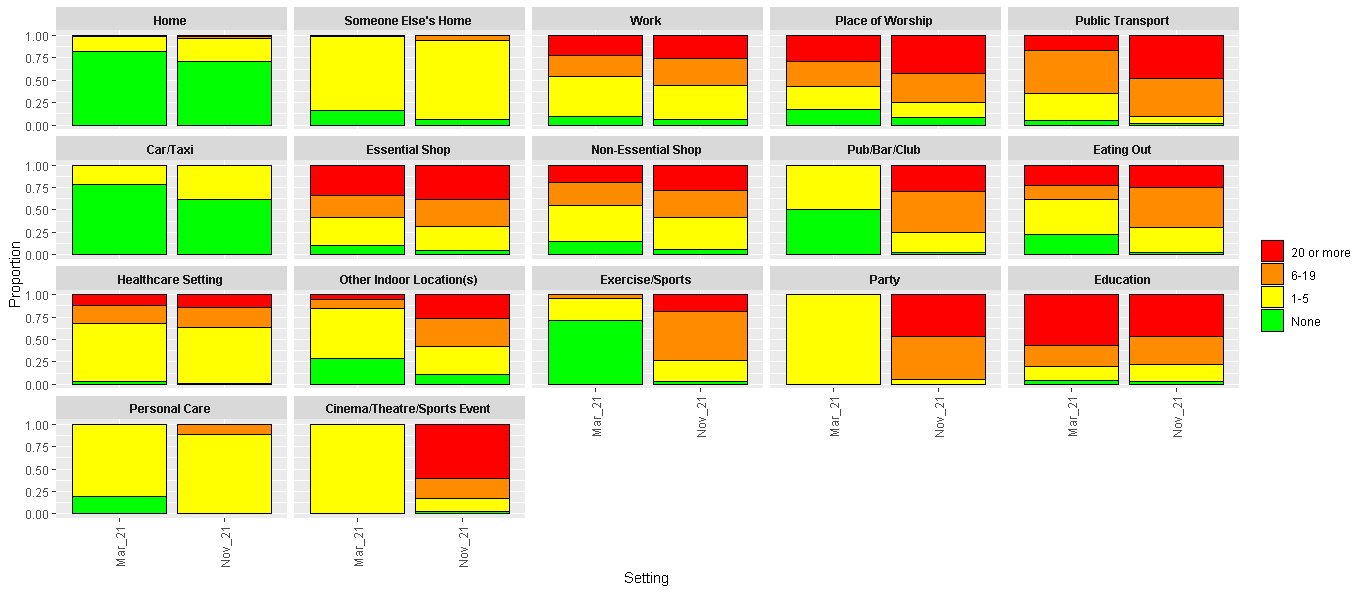
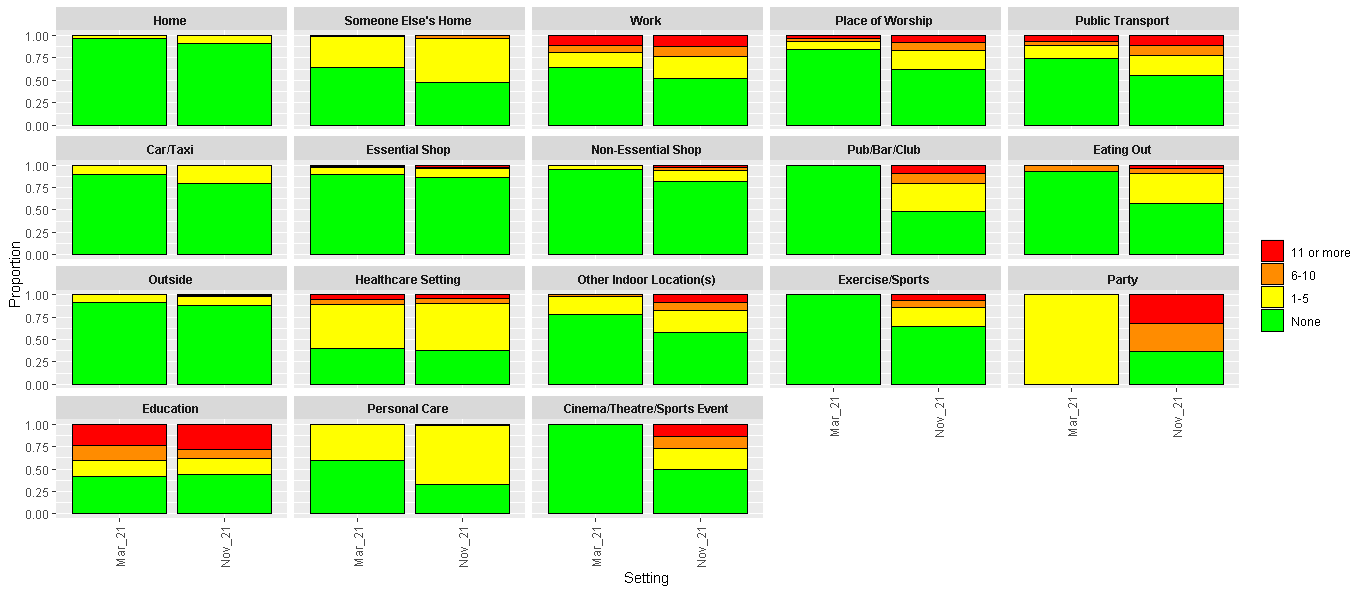
Figure 4. Number of Close Contacts by Setting (excl. household members)
7. Risk of SARS-CoV-2 Infection by Occupation
Workers differ in their risk of SARS-CoV-2 infection according to their occupation but more work is needed to fully describe how occupation directly contributes to an individual’s risk of infection. Our analysis aimed to investigate how infection risk differed across occupational groups in England and Wales up to October 2021.
Participants were 12,182 adults employed or self-employed adults (≥16 years) in the Virus Watch cohort who reported their occupation. Occupations were classified into groups adapted from the UK ONS to reflect workplace environment. Where group sizes were large enough, we also investigated specific frontline occupations.
We calculated each occupational group’s relative risk of virologically-confirmed (LFT or PCR) or serologically-confirmed infection compared to: 1) Other Professional and Associate occupations (broadly office-based professional occupations with a low absolute infection risk) and 2) the working population excluding the occupation under investigation. We accounted for the effect of age, sex, ethnicity, region, deprivation and household size, vulnerability status, and non-work public activities in our analysis.
Compared to Other Professional and Associate occupations, healthcare, teaching/education/childcare, indoor trade and process/plant, and leisure and personal service occupations demonstrated higher risk of SARS-CoV-2 infection. Belonging to their occupation compared to the less risky group accounted for between 20% (for leisure and personal service) to 42% (for healthcare workers) of their infection risk. Healthcare and teaching occupations also demonstrated elevated risk compared to all other workers.
The following specific frontline occupations had elevated infection risk compared to both office-based professional occupations (Figure 5) and to all other workers: nurses (with their occupation accounting for 47% of their risk); doctors (42% of their risk); carers (54% of their risk); teachers (primary 48%; secondary 39% of their risk), and warehouse and process/plant workers (37% of their risk),
Most at-risk occupations demonstrated elevated risk in the earlier pandemic phase (Waves 1 and 2) that was later attenuated (Wave 3), but risk remained elevated in Wave 3 for teachers (Figure 5)
Figure 5. Risk Ratios for Frontline Occupations (versus Other Professional and Associate Occupations)
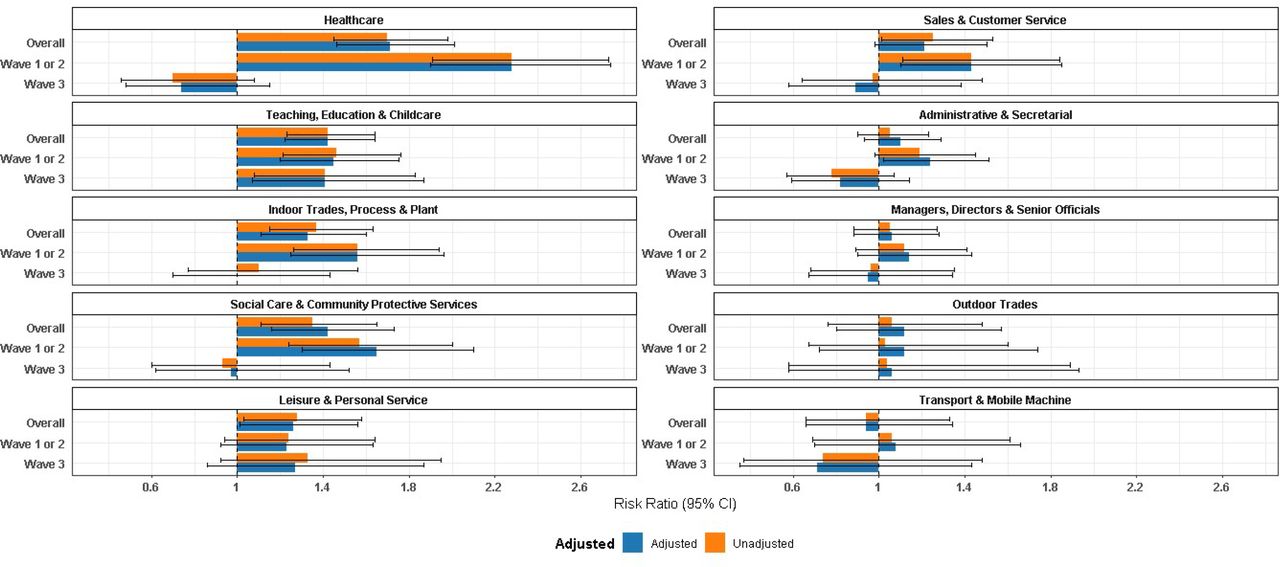
Note:
- All results are provisional and subject to revision.
- These statistics refer to cases reported by Virus Watch participants in the community.
- Unadjusted models include occupation only. Adjusted models account for age, sex, ethnicity, region, deprivation and household size, vulnerability status, and non-work public activities.
Please see this link for our full analysis.
8. Workplace Contact Patterns in England during the COVID-19 Pandemic
Workplaces are an important potential source of SARS-CoV-2 exposure; however, investigation into workplace contact patterns is lacking. This study aimed to investigate how workplace attendance and features of contact varied between occupations and over time during the COVID-19 pandemic in England.
Data were obtained from electronic contact diaries submitted between November 2020 and November 2021 by employed/self-employed prospective cohort study participants (n=4,616). We investigated the main effects and potential interactions between occupation and time for: workplace attendance, number of people in shared workspace, time spent sharing workspace, number of close contacts, and usage of face coverings.
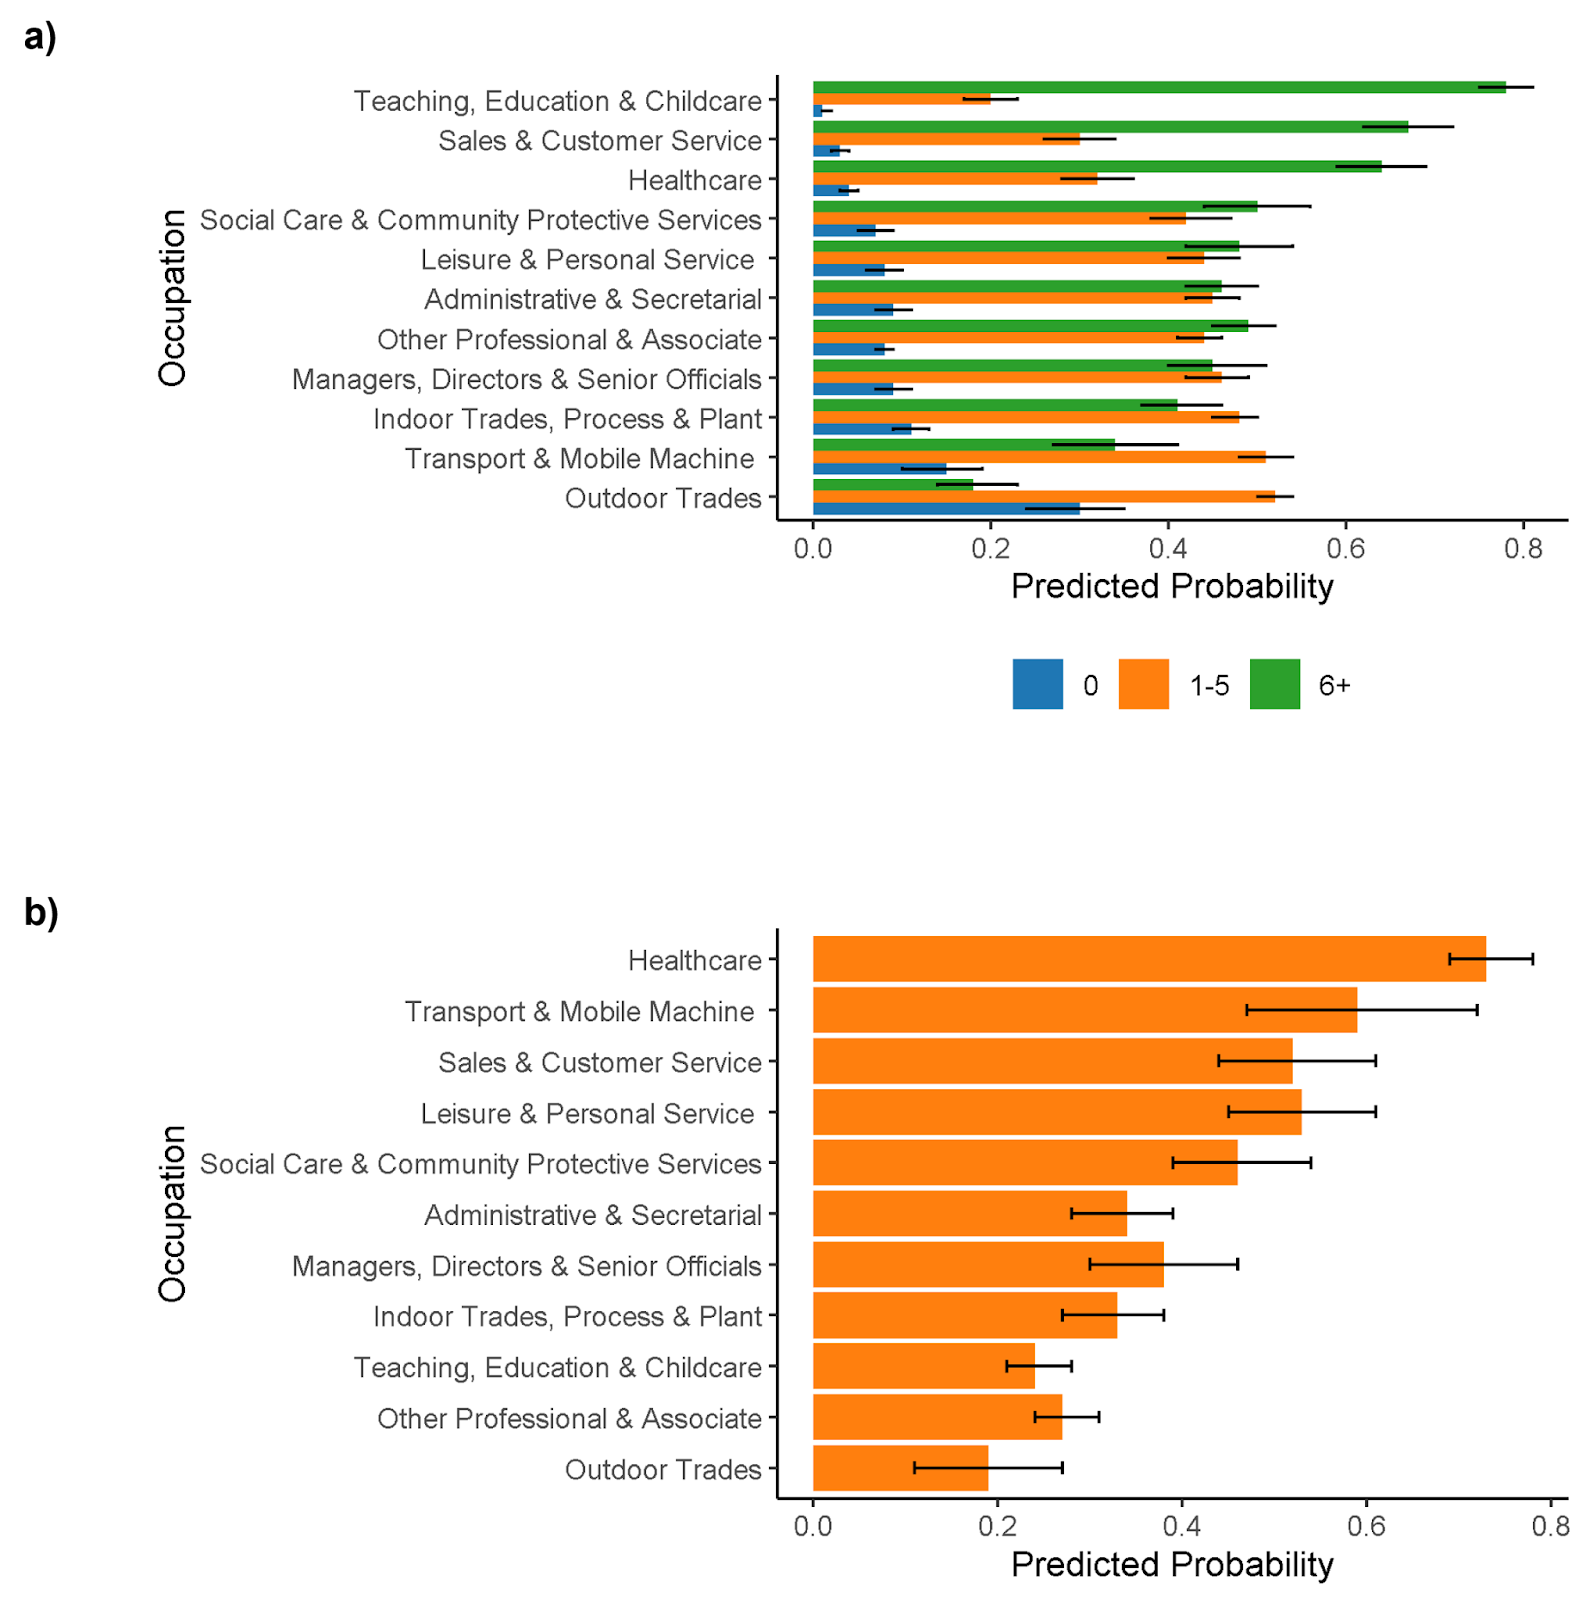
Outdoor- and indoor-based trade occupations were persistently likely to attend in-person workplaces (up to 69% predicted probability of attendance). Teachers were also likely to attend in person, except during the school holidays. In person attendance increased substantially between March and April 2021 for leisure/service occupations (from 40% to 57% probability of attendance), likely reflecting sectoral reopenings. Other Professional and Associate occupations were persistently the least likely group to attend in-person (predicted probability range 16%-26%), with a trend for increased attendance from July 2021 onwards.
Education and healthcare workers tended to share the workspace with a higher number of people and to have more close contacts than most other occupations (Figure 6a). Workspace sharing was common across occupations and tended to be long-term (>4 hours).
There was a gradient of likelihood for wearing a face mask during close contact (Figure 6b), with the highest probabilities in healthcare and transport occupations and the lowest in teaching, other professional and associate, and outdoor trade occupations.
Across all occupations, participants were about half as likely to share their workspace and have close contact in the workplace between November 2020 and July 2021 compared to November 2021. There was no difference between September 2021 and November 2021, indicating that this is when the increase occurred. Face covering usage was dramatically more likely in early phases of the pandemic, with odds up to 20X higher during the height of the lockdown in March 2021 compared to November 2021.
Figure 6. Predicted Probabilities by Occupational Group for Maximum Number of People in Workspace (a) and Wearing a Face Covering during Close Contact at Work (b)
Note:
- All results are provisional and subject to revision.
- These statistics refer to cases reported by Virus Watch participants in the community.
Please see this link for our full analysis.
9. Characteristics of households and individuals in Virus Watch
Virus Watch began recruiting people in June 2020 and as of 20th Dec 2021, 24,287 households and 58,233 people across England and Wales have joined the study. (Table 2).
Table 2. Participants in Virus Watch, 20th December 2021
| Characteristic | All Virus Watch participants on 20th December 2021 | ONS (%)* |
| All | 58,233 | (100%) |
| Age Group | ||
| 0-15 | 7,314 (13%) | (19.1%) |
| 16-24 | 3,481 (6%) | (10.6%) |
| 25-44 | 11,626 (20%) | (26.1%) |
| 45-64 | 19,537 (34%) | (25.6%) |
| 65+ | 16,275 (28%) | (18.5%) |
| Ethnicity | ||
| White British | 40,152 (69%) | (80.5%) |
| White Irish | 668 (1%) | (0.9%) |
| White Other | 2,800 (5%) | (4.4%) |
| Mixed | 988 (2%) | (2.2%) |
| South Asian | 2,728 (5%) | (5.3%) |
| Other Asian | 425 (1%) | (2.2%) |
| Black | 491 (1%) | (3.3%) |
| Other Ethnicity | 286 (<1%) | (1%) |
| Prefer not to say | 194 (<1%) | (-) |
| Missing | 9,501 (16%) | – |
| Sex | ||
| Male | 21,536 (37%) | (49.4%) |
| Female | 27,293 (47 %) | (50.6%) |
| Missing/Prefer not to say | 9,404 (16%) | – |
| Region | ||
| East Midlands | 4,890 (8%) | (4.5%) |
| East of England | 10,497 (18%) | (12.4%) |
| London | 9,033 (16%) | (9.3%) |
| North East | 2,530 (4%) | (8.1%) |
| North West | 5,520 (10%) | (10%) |
| South East | 9,769 (17%) | (10.5%) |
| South West | 3,933 (7%) | (15.1%) |
| Wales | 1,508 (3%) | (15.4%) |
| West Midlands | 2,988 (5%) | (9.5%) |
| Yorkshire and The Humber | 3,011 (%) | (5.3%) |
| Missing | 4,554 (8%) | – |
*ONS = Office for National Statistics. ONS data for age and region drawn from Mid-2019 Estimates of the Population for the UK, England, and Wales, Scotland and Northern Ireland (figures for England and Wales). ONS data for household size drawn from Families and Households in the UK 2019 (UK wide estimates).